Go Cougs!
Washington State University
—WSU is a top research university dedicated to improving lives, unlocking possibilities for students, and serving the public good
- 6 campuses
- 11 academic colleges
- Extension offices in all 39 Washington counties
- 4 research and extension centers

WSU President Kirk Schulz to retire in June 2025
The Board of Regents will begin the search and transition process for a new president later this month.

Pullman
Our oldest and largest campus, WSU Pullman’s beautiful grounds and state-of-the-art facilities support more than 200 undergraduate, graduate, and professional programs.
Explore WSU Pullman

Spokane
Located in Washington’s second-largest city, WSU’s health sciences campus is focused on preparing physicians, nurses, pharmacists, and other health professionals.
Explore WSU Spokane

Tri-Cities
With an emphasis on energy, the environment and agriculture, the Tri-Cities campus delivers career-connected learning and innovative research to address economic and social challenges.
Explore WSU Tri-Cities

Vancouver
Located in the dynamic Vancouver/Portland metro area, this campus is known for its close-knit student community and real world research opportunities.
Explore WSU Vancouver

Global
In addition to our brick-and-mortar campuses, WSU Global Campus serves more than 4,000 students worldwide through online undergraduate, graduate, and certificate programs.
Explore Global

Everett
Located about 30 miles north of Seattle, WSU Everett offers junior- and senior-level courses in high-demand bachelor’s degree programs designed to prepare students to compete globally.
Explore Everett
What’s Happening At WSU

WSU’s pavilion at Expo ’74 drew 1.5 million visitors
Organizers of the Spokane World’s Fair approached the university about creating a water-themed exhibit, called Waterworld

WSU Extension adds climate awareness to its programming
Extension sites across Washington are offering classes on a range of topics to promote climate change mitigation and adaptation

Clinic has improved access for kids with autism spectrum disorder
The Autism and Neurodevelopmental Clinic has reduced the wait time for evaluations significantly in its first year of operation
The WSU Difference

35%
students who are first in their family to attend college
WSU students get the tools they need to find untapped strengths, with hundreds of majors and degree programs, research opportunities, fieldwork, internships, and study-abroad programs
Health, clean energy, food production, economic opportunity, security—research advances made by WSU scientists raise quality of life worldwide
$368 million
annual research funding, fy 2022


284,590 hours
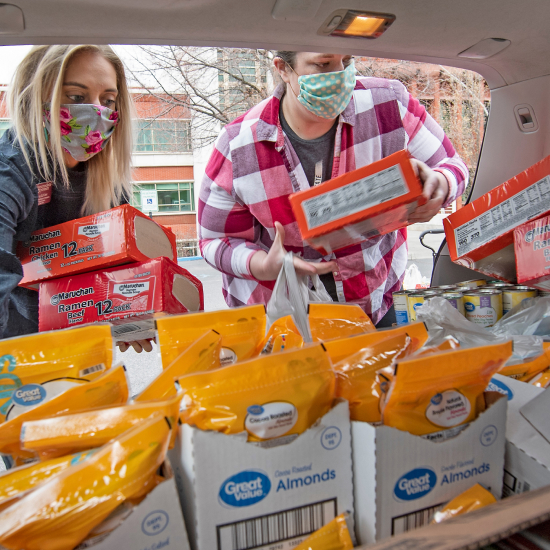
civic engagement by WSU student and WSU Extension volunteers (2022)
WSU boosts Washington state’s economy by billions of dollars a year and WSU researchers create jobs when they bring their innovations to market